Colin Foster's Mathematics Education Blog

30 March 2023

Teaching specific tactics for problem solving

This is my final blogpost, as my year as President of the Mathematical Association draws to a close, so I've allowed myself to go on at slightly longer length than usual. I wanted to conclude this series by thinking about problem solving, which for me is always the ultimate goal of learning mathematics. How can we help students not just to 'do problem solving' but actually learn to get better at it?

What I mean by problem solving

The term problem solving is used in different ways in different strands of the research literature (Note 1, see Foster, under review). Sometimes 'a problem' just means any mathematics question at all, such as a 'word problem', which might be an ordinary mathematics question dressed up in some 'real-life' context. But when I talk about a mathematics 'problem' I mean a non-routine task - in other words, a problem which the student doesn't have a ready-made method for solving - and this is the usual definition within the mathematics education literature. This means that whether something is a problem or not for any particular person depends on what methods they happen to have at their disposal at that particular time (see Foster, 2019, 2021).

The illustration that I like to use is of driving into a tunnel (Figure 1). Sometimes, before you enter a tunnel, you can see daylight out of the other side. The tunnel might still be quite long, but it is straight enough for you to see the entire route through before you begin. This is analogous to a routine task (Note 2), or exercise. Such tasks can be important for developing fluency with useful procedures - I am not saying 'routine is bad'. But with a routine task there is no challenge in deciding what to do, as that's clear from the outset.

The alternative scenario is a tunnel which you cannot see right through. You don't know before you enter if you will need to turn left or right - there might even be a dead-end and you could have to turn around and try a different approach. You might have some ideas for starting, but at the outset you don't know exactly how you're going to proceed - you will have to be flexible and respond to what happens; the first thing you try may not work. This is what I call a non-routine task, or problem.

Figure 1. A Routine task (left) versus a Non-routine task (right)

It's important to realise that routine tasks are not necessarily quick and easy - they may be multi-step and require serious thought. When I say 'routine' I am not implying 'trivial'. For example, multiplying two 5-digit numbers together is a routine task for a mathematics teacher, because we know algorithms to use for this (whereas it wouldn't be for a child who hadn't learned a multiplication algorithm). However, even though a 5-digit by 5-digit multiplication is routine, I might easily make a mistake and get the wrong answer. But, even if I mess it up, it's still a routine task, because I know beforehand exactly how I should do it (Note 3).

So, if we accept that being able to tackle non-routine tasks (i.e., problems) is an important outcome of education, how do we help students get to the point where they are powerful problem solvers? It can't be enough simply to throw non-routine problems at them and watch them struggle. If we do that, a tiny minority may somehow discover the necessary problem-solving strategies to succeed, while the vast majority simply struggle to get anywhere and conclude that they must be not natural problem solvers. Instead, I think we need to explicitly teach these problem-solving strategies to everyone. But do these 'strategies' exist, and, if so, what are they?

A story about chess

When I was at primary school, my father taught me to play chess. What I mean is that he taught me the object of the game and the rules for how the pieces move. As far as either of us knew, that is what it meant to ‘learn chess’. I assumed that any further improvement would just come the more I practised, meaning the more games I played. At primary school, some children played chess at lunchtime, and I was considered to be good at chess, because I knew all the rules, and would try to think more than a move ahead, and anticipate what my opponent might do. With hindsight, I also suspect that people assumed I was good at chess because I was good at mathematics.

At secondary school, there was a chess club, which I joined, and, as before, I was one of the ones who knew the rules of chess, so I was treated as an expert, and I helped to teach others. We played in competitions against other schools, who had similar kinds of chess clubs, and sometimes we won games and sometimes they did – it was pretty random. Until one day we played against a local independent (private) school, and we all lost all our games within just a few minutes. What was going on? Were these ‘posh’ students just ‘clever’? Apparently the teacher who ran their chess club had played chess himself in national competitions, so perhaps that had something to do with it. Whatever the reason, we never lost against that school again - because we never played them again!

It wasn’t until I went to university, where nearly everyone had come from an independent school, that I discovered that people who had no interest in chess at all could beat me, which seemed very odd. I had assumed that those students in the chess team that beat us at school must have all been obsessively committed chess nerds, but actually I'm sure now that for most of them chess was just one of a hundred things they did fairly half-heartedly. The difference wasn’t, as we had assumed, that they had practised super-intensively, or were somehow smarter at thinking more moves ahead than we were. It was, of course, that they had been taught specific moves to use, and strategies for different points in the game (openings, endings, etc.), and had maybe even been shown some famous games. I had never realised that there were books about chess (e.g., Fischer, Margulies, & Mosenfelder, 1982) – and, if I had seen such books on the shelf, I would probably have assumed that they would not be interesting to me, and would be merely explaining the rules of the game, which I already knew. And if I had realised that such books taught strategies I might even have concluded that reading such a book was tantamount to cheating. You have to come up with your own moves, surely, otherwise that isn’t ‘playing the game’?

Teaching the rules but not the strategies

The reason for telling this story is that I think something a bit similar to this situation goes on in the teaching of mathematics in schools. Every teacher teaches students ‘the rules of the game’, such as that the angle sum of a plane triangle is $180^\circ$, and then we give students increasingly challenging problems to solve that depend on these rules. We might even tell ourselves that the problems “only require knowledge of” such-and-such short list of ‘angle facts’, and therefore that the students 'should' be able to solve them. When they get stuck, we might say, “Keep persevering – you know everything you need to know to solve it – you just need to keep thinking!” – but is that really true? This feels like saying that if you know the rules of chess then you know everything you need to know to win any game against any opponent, which I guess is what I thought as a child.

I began thinking back on all of this when I heard some teachers discussing what may be the most notorious example of a ‘hard but elementary’ angle problem. It is known as “Langley's Adventitious Angles”, and was posed by Edward Langley (Note 4) in The Mathematical Gazette in 1922. It involves what is sometimes referred to as the 80-80-20 triangle (see Figure 1). The task is to show that $x = 30$.

$ABC$ is an isosceles triangle.
$B = C = 80^\circ$.
$CF$ at $30^\circ$ to $AC$ cuts $AB$ in $F$.
$BE$ at $20^\circ$ to $AB$ cuts $AC$ in $E$.
Prove $BEF = 30^\circ$.
Figure 1. Edward Langley’s original problem (Langley, 1922, p. 173).

Since the problem was posed, over 40 different solutions have been produced (Chen, 2019; Rike, 2002; see also related problems in Leikin, 2001). However, most people find it extremely difficult to obtain a solution, and simply ‘angle chasing’ around, adding and subtracting angles, doesn't get you anywhere. On the other hand, the heavy machinery of things like trigonometry is not necessary either. So, this has been called “The World’s Hardest Easy Geometry Problem” – easy in the sense that it requires only elementary facts from geometry; hard because it’s extremely difficult to see how to use those elementary facts to solve it!

This raises the question 'Why is it that people can't solve this problem?' Similar questions are sometimes asked about the lovely geometry problems that Catriona Agg tweets (as @Cshearer41, see Shearer & Agg, 2019).  I have heard plenty of highly competent mathematics teachers saying that, although they also really like her problems, they can't actually do them. So it's interesting to ask why not. Is it because the problems depend on knowledge of highly-advance geometrical theorems that these teachers have never studied? Of course not. All of Catriona's problems depend on simple school-level geometry - but they are hard nonetheless!

I think the missing ingredient is problem-solving tactics (finer grained than 'strategies'). Of course, content knowledge of geometry (e.g., the angle sum of a plane triangle is $180^\circ$) is essential. It is necessary but not sufficient. You can have encyclopaedic knowledge of all the geometry theorems in the world, but still be unable to apply them. So, I think success depends on having access to problem-solving tactics, and by this I don't mean high-level Polya-style generic strategies like 'draw a diagram' or 'be systematic'. Those are true, but hard to apply in any particular situation of being stuck (Schoenfeld, 1985). I mean much more topic-specific strategies (Foster, under review). In the case of Langley’s problem, the key strategy turns out to be to add an auxiliary line to the diagram, choosing the position wisely, so that it is parallel to a line that is already there, so creating corresponding or alternate angles or similar triangles (Note 5 - spoiler alert there!).

My recent Economic and Social Research Council (ESRC) project, Exploring socially-distributed professional knowledge for coherent curriculum design, carried out in collaboration with Professor Geoff Wake, Dr Fay Baldry and Professor Keiichi Nishimura in Japan, explored how the mathematics curriculum is designed and taught in Japan. In Japan, teachers explicitly teach problem-solving strategies, such as 'add an auxiliary line' (see Baldry et al., 2022). In the problem-solving strand of the LUMEN Curriculum resources, which we are currently designing at Loughborough University, the lessons explicitly and systematically teach problem-solving strategies like these, using problems which are dramatically unlocked by that strategy. The aim is for all students to build up a toolbox of these strategies, along with the knowledge of which one is likely to be useful for which problems. We are hoping that this will leave less to chance, and be a more effective way of helping all students become powerful problem solvers.

Concluding thoughts

Writing these 26 blogposts over the course of my year as President of the Mathematical Association has been a great pleasure, and I have particularly appreciated the many people who have got in touch with comments and reactions. Please continue to follow my work on Twitter @colinfoster77 and through my website https://www.foster77.co.uk/, and I hope to see many of you at the Joint Conference of Mathematics Subject Associations 2023 next week!

Questions to reflect on

1. Do you agree about the value of teaching problem-solving tactics, in addition to 'content'? Why / why not?

2. Where in your teaching/curriculum do students encounter strategies such as 'Draw in an auxiliary line'?

3. How might you plan to teach other problem-solving tactics explicitly?

Notes

1. I talked about many of the ideas in this post in my conversation with Ben Gordon on his podcast (BAGs to Learn Podcast by Ben Gordon, 2021).

2. I use 'task' to refer to anything mathematical a student is asked to do: it could be written, oral or practical.

3. It is actually a bit more subtle than this, because if the two 5-digit numbers that you asked me to multiply together happened to be, say, 11111 and 11111, then that might turn it into a non-routine task - i.e., a problem - because I might wish to avoid plodding through a standard algorithm and instead exploit the repdigit nature of these two numbers. However, on the other hand, if I had played around with such numbers before, I might know how strings of 1s behave when multiplied, and even know exactly how to write down the answer immediately, and so it would be back to being a non-routine exercise. So, whether something is routine or not depends in detail on what you happen to know.

4. Langley was the founding editor of The Mathematical Gazette. A curious fact is that he apparently had a blackberry named after him – not a lot of people can say that!

5. One possible solution is given in the diagrams below:
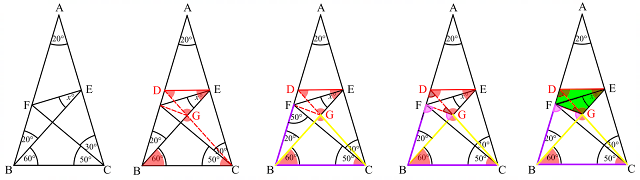
Adding in the auxiliary line $DE$, parallel to $BC$, and joining $D$ to $C$, creates $60^\circ$ angles (all shaded in red), and thus equilateral triangles. Since $BFC = 50^\circ$, $BCF$ is isosceles, so the purple line segments are equal, and since $BCG$ is equilateral, the yellow line segments are equal to the purple line segments. This means that triangle $BFG$ is isosceles, and so the pink angles must both be $80^\circ$, which means that the brown angles must both be $40^\circ$, which means that the two green triangles $DEF$ and $GEF$ are congruent. And so $x$ is half of angle $DEG$, which is $30^\circ$. 

References

BAGs to Learn Podcast by Ben Gordon (2021, December 2). Episode 4 – Colin Foster – Problem Solving in the mathematics curriculum [Audio podcast]. https://anchor.fm/ben-gordon83/episodes/Episode-4---Colin-Foster---Problem-Solving-in-the-mathematics-curriculum-e1b5ic3

Baldry, F., Mann, J., Horsman, R., Koiwa, D., & Foster, C. (2021). The use of carefully-planned board-work to support the productive discussion of multiple student responses in a Japanese problem-solving lesson. Journal of Mathematics Teacher Education. Advance online publication. https://doi.org/10.1007/s10857-021-09511-6

Chen, Y. (2019). 103.39 A lemma to solve Langley’s problem. The Mathematical Gazette, 103(558), 521-524. https://doi.org/10.1017/mag.2019.121

Fischer, B., Margulies, S., & Mosenfelder, D. (1982). Bobby Fischer teaches chess. Bantam Books.

Foster, C. (2019). The fundamental problem with teaching problem solving. Mathematics Teaching, 265, 8–10. https://www.atm.org.uk/write/MediaUploads/Journals/MT265/MT26503.pdf

Foster, C. (2021). Problem solving and prior knowledge. Mathematics in School, 50(4), 6–8. https://www.foster77.co.uk/Foster,%20Mathematics%20in%20School,%20Problem%20solving%20and%20prior%20knowledge.pdf

Foster, C. (2023). Problem solving in the mathematics curriculum: From domain-general strategies to domain-specific tactics. The Curriculum Journal. Advance online publication. https://doi.org/10.1002/curj.213

Langley, E. M. (1922). Problem 644. The Mathematical Gazette, 11(160), 173. https://doi.org/10.2307/3604747 

Leikin, R. (2001). Dividable triangles—what are they? The Mathematics Teacher, 94(5), 392-398. https://doi.org/10.5951/MT.94.5.0392

Quadling, D. A. (1978). Last words on adventitious angles. The Mathematical Gazette, 174-183. https://doi.org/10.2307/3616686

Rike, T. (2002). An intriguing geometry problem. Berkeley Math Circle, 1-4.

Schoenfeld, A. H. (1985). Mathematical problem solving. Elsevier.

Shearer, C. & Agg, K. (2019). Geometry puzzles in felt tip: A compilation of puzzles from 2018. Independent.


16 March 2023

Crocodiles and inequality signs

Teachers of mathematics seem not to be particularly fond of crocodiles/alligators when they are used to give meaning to the inequality signs $<$ and $>$. What are the problems with doing this, and should we resist all anthropomorphising or zoomorphising of mathematical symbols?

It's long been noticed that a crocodile's mouth looks a little bit like an inequality symbol, $<$. Furthermore, crocodiles are (apparently?) greedy and, when given the choice, always eat the larger object (Figure 1). And so we can use this as a rationale for writing $3<4$ and $4>3$.

Figure 1. Will a hungry crocodile eat a mouse or an elephant?

Now, framed in this way, clearly this is a bit silly. Even very young children are likely to wonder:

What if the crocodile isn't hungry?

What if the smaller animal is tastier, more nutritious, easier to catch, or less likely to attack than the larger animal?

Is this 'just a bit of fun', not to be taken too seriously? Are we showing a 'sense of humour failure' by making a fuss? Or is this perhaps where, even at a really young age, children begin to subtly experience being asked to suspend all common sense - and, indeed, their age-appropriate knowledge of biology - when doing mathematics? Perhaps this is an example of when children begin to get used to the idea that success in mathematics means accepting nonsensical statements and claims? Before long, learners will talk as though some things are "true in maths but not in real life". Is this zoomorphism of an inequality symbol the thin end of a $<$-shaped wedge that we would just be much better off without?

I tend to think that the crocodiles are really unnecessary here. Certainly, the $<$ symbol has a 'small end' and a 'large end'. The greater quantity goes at the larger end, and that's all you need to know. There is no need to bring animals with long jaws into it at all. But are my observations on the shape of the $<$ symbol also playing with symbols in an unhelpful way and part of the same kind of problem - trying to make the 'abstract' symbol more 'iconic' than it really is?

What does the research say? Wege, Batchelor, Inglis, Mistry and Schlimm (2020) found that mathematical signs that visually resembled the concepts they represent were easier to use than those that didn't, and they advised, for instance, "choosing symmetric symbols for commutative operations and asymmetric symbols for non-commutative operations" (p. 388). It seems that even experienced mathematicians find it easier to work with symbols whose properties mirror those of the concept being expressed. Imagine being forced to use $<$ to represent 'greater than' and $>$ to represent 'less than'. There is more than unfamiliarity to overcome there, but an obstinate reversal of the 'natural' way round that fits the meaning of these symbols. Although symbols like this are clearly arbitrary, in that they could have been otherwise, that doesn't mean that they were created totally at random, without rhyme or reason.

The equals sign $=$, for example, originates from the idea of expressing ‘equality’ of the left-hand side (LHS) and the right-hand side (RHS) by using two, parallel, ‘equal’ lines:

LHS $=$ RHS

Understood this way, one of those lines can be thought of as representing the value of the LHS of the equation and the other one the value of the RHS of the equation. But it is unclear which is which. This doesn’t really matter, I suppose, but perhaps this symbol would be more transparent if if it were rotated through $90^\circ$:

LHS $\lvert  \rvert$ RHS

Now, the left-hand vertical line represents the value of the LHS and the right-hand vertical line represents the value of the RHS, and these being the same length represents equality of the two sides.

I suppose there could be the danger with this of thinking that $\lvert  \rvert$ was the number eleven, but we get round that kind of ambiguity all the time with mathematical symbols. For instance, we use modulus symbols to write things like

$\lvert -11 \rvert=11,$

carefully making the modulus lines a little longer that the $1$s, and we seem to get away with having at least five different meanings for a short line segment in this equation. 

But the really nice thing about using $\lvert  \rvert$ for equality would be that we could use very natural symbols for greater than and less than:

$3 < 4$ becomes $3 $ |$\rvert \; 4 $

$4 > 3$ becomes $4 \; \lvert$|$ \; 3$

The ‘rule’ (if you even need to call it that) is that the shorter line refers to the smaller side and the longer line refers to the greater side. But it hardly even needs saying. You could just start using symbols with this level of transparency, and learners would quickly infer what was going on.

I am not saying this would be worth doing. This post is not really making any practical suggestions; rather, it is a thought experiment. When might there be a benefit in replacing something arbitrary with something a little bit less arbitrary (though still arbitrary!)? Or in involving learners in discussing what kinds of symbols they think might appropriately represent various operations or relations? Should we always go straight to the conventional, correct symbol that 'mathematicians' use? Or are there times when it might be worth using more transparent but informal alternatives, while learners are in the process of getting to grips with the concepts, and then later transition to the more formal symbols, perhaps after appreciating some of the inconveniences with the less formal versions?

After all, writing $3 $ |$\rvert \; 4 $ is all very well, but how would you express $3 \le 4$, and how would you handle double (or more) inequalities, like  $3 < 4 < 5$? I think it would get quite messy and awkward. In our usual notation, I do like the way in which we show 'approximately' by making the straight lines wiggly in $3 \approx 4$ and I like how we can show 'much less than' as $3 \ll 4000$. I like how in $\LaTeX$ we can even extend this by using the code '\lll' and write $3 \lll 10^{100}$, with a symbol composed of three less-than symbols.

I am left wondering whether it is any worse to call the $<$ symbol 'a crocodile' than it is to refer to $\bar{x}$ as '$x$ bar' or $\hat{x}$ as '$x$ hat'? Can these really be 'informal' names if they are what 'everyone' calls them? I notice as I type these in $\LaTeX$ that 'bar' and 'hat' are precisely the words I need to type to produce them, so knowing these names is actually quite useful.

Questions to reflect on 

1. When is anthropomorphising or zoomorphising mathematical symbols OK and when is it not?

2. When are 'informal' names for symbols OK and when should they be avoided?

2. Is it ever worth introducing made-up, informal versions of symbols (or names for them), with learners? Can they be a useful stepping stone towards formal symbols, or are they just extra things that learners will have to 'unlearn' later? 

Reference

Wege, T. E., Batchelor, S., Inglis, M., Mistry, H., & Schlimm, D. (2020). Iconicity in mathematical notation: Commutativity and symmetry. Journal of Numerical Cognition, 6(3), 378-392. https://doi.org/10.5964/jnc.v6i3.314 


02 March 2023

Are probabilities and inequalities approximate?

If mathematics is about being certain and precise, then how can probability be part of mathematics, because probability is about not being sure?

Probabilities are all about measuring and quantifying uncertainty. But I think that students are often a bit confused about what this means. One thoughtful student began writing all her answers to probability questions using the $\approx$ symbol. When asked why she was doing this, she said, “Well, probabilities are just probabilities – they’re not exact”.

It struck me that there are a few different things that she might have meant by this. She might have meant that, when flipping a £1 coin, say, p(Heads) $\approx\frac{1}{2}$, because no coin toss in the real world can ever be perfectly balanced, with precisely equal probability of landing on either side. Any real coin, undergoing any real throw, will be at least a little bit biased one way or the other (Note 1). So, maybe the $\approx$ symbol is communicating this approximate feature. However, that would seem to apply to all real-world measurements, of any kind, since no measurement can be made with absolute precision. If we say that the diameter of the coin is 22.5 mm, this will have to be $\pm$ some margin of error. So, on this basis, all lengths (and, indeed all measurements) would have to use the $\approx$ symbol too, and she wasn't doing that.

Alternatively, the approximate aspect that the student was thinking about might have been the uncertainty of the outcome on any single coin flip. On a frequentist view, probabilities are about long-run averages of relative frequencies, not individual instances. Even if we knew for some hypothetical coin that p(Heads) were precisely equal to $\frac{1}{2}$, that wouldn't help us to predict on any given flip whether the coin would come down Heads or Tails. There is still uncertainty, so perhaps it was this uncertainty that the student was wishing to capture in her use of the $\approx$ symbol. 

Although $\frac{1}{2}$ is exactly in the middle of the probability scale that runs from $0$ to $1$, in a sense it represents maximum uncertainty, since if the probability were to take any other value we would stand a better chance of being able to predict the outcome on a single throw of the coin. If p(Heads) were 0.6, we could bet on Heads, and we'd expect to be right more than half of the time; if p(Heads) were 0.4, we could bet on Tails, and we'd expect to be right more than half of the time. But with p(Heads) at precisely 0.5 no strategy in the long-run will enable us to predict outcomes with better than 50% accuracy.

It can be hard to help students see that an uncertain outcome does not necessarily imply an approximate probability. We may be able to state a perfectly precise probability for an event, but, unless that probability is $0$ or $1$, we will still have uncertainty over what outcome we will obtain in any particular instance. I think I have often skated over such issues when teaching probability, and inadvertently left students thinking that the topic of probability is all about guesswork and approximation (e.g., subjective probabilities, such as that a particular football team will win a particular match).

Inequalities

I have seen similar reactions from students to work on solving inequalities - it feels like it isn't proper mathematics, because we are not getting 'a definite answer'.

When we solve an equation like $2x+5=11$, we obtain an exact solution, $x=3$. We find that $x$ takes this one specific value, and no other, and that is that. But, when we solve an inequality like $2x+5>11$, we obtain a solution expressed as another inequality, $x>3$, and this may seem to students to be expressing some uncertainty, perhaps a bit like a probability. We've just replaced one vague inequality with another vague inequality; we still don’t exactly know what value $x$ takes! It might be $4$, it might be $3.1$, it might be $4$ $000$ $000$. There are infinitely many possibilities, just as there were before we began solving it, so it seems as though we have made little progress. "So we still don't know what $x$ is!" a student might complain.

'Solving an inequality' feels like a contradiction in terms. For the students, 'Solving' means 'Finding the answer'. They might concede to saying 'Or answers', perhaps for a quadratic equation, where they know that they haven't solved the equation until they've stated all the possible answers. Or, with simultaneous equations, where the values of both unknowns need to be found before someone can claim to have solved it. But here there are infinitely many possible answers, so we seem to know very little indeed about what the value of $x$ is!

However, infinitely many possible value have also been ruled out, so this is progress! We have eliminated all values of $x \le 3$. Before we began, $x$ could have been anywhere on the real number line; now we know that it can only be in the open interval to the right of $3$.

The fact that $x>3$ means that $x$ is "definitely more than precisely $3$" is, I think, sometimes not clear to students. They see inequalities as approximate because one way to think about them is that they capture uncertainty and tell us 'what $x$ might be'. This language of probability seems unfortunate here. If the solving of equations has been introduced to students through "I'm thinking of a number", and the student has to use the equation (like a 'clue') to figure out what the number is, then this may be problematic when we move to inequalities. The student has zero probability of being able to determine the teacher's secret number if the clue is 'just an inequality'.

Perhaps a better way to talk about this is in terms of solution set: all the values of $x$ that satisfy the equation or inequality. This way, we don't envisage that there is a single 'right answer', and we just unfortunately don't have enough information to determine it, since our single piece of information happens to be an inequality, which is 'imprecise' or 'vague'. Instead, we see our task as wanting to describe all the possible values of $x$ that are consistent with the given information. When we solve equations, that often turns out to be just one or two. With an inequality, we want to capture precisely those values that satisfy it. So $x>3$ is not saying that "$x$ is some number greater than 3, but we unfortunately don't know which number". Instead, we're saying that "the solution set is all of the numbers greater than 3 and no others".

I think this is the way I would deal with a problem I've sometimes seen, where a student writes something like $x>2$ and claims that this is correct. "No," you say. "The answer is that $x$ is greater than 3." And the student says, "Well, if the mystery number we're looking for is greater than 3, then it's certainly going to be greater than 2, so I'm right!" They think you can't mark them wrong for making a true statement about this 'mystery number'. Your answer may have pinned the number down slightly more tightly, by ruling out the numbers between 2 and 3, but $x>2$ is right too (in a way in which something like $x<2$ wouldn't be) (Note 2)!

The point is that we're not seeking a single mystery number, and trying to guess what it might be, but a solution set of all the possible numbers. The student's solution set $x>2$ contains a whole load of numbers that are less than or equal to 3, and these are not just unnecessary but impossible, so the student's solution set is the wrong one.

If we want to avoid these difficulties, then there is certainly more to solving linear inequalities than just "Solve it like an equation, but put the inequality sign instead of the equals sign!" But I think the idea of treating an unknown as a 'mystery number' perhaps has its problems when it comes to solving inequalities. We don't just want any old interval that definitely contains a certain mystery number; we want an interval that doesn't contain any numbers which the given inequality rules out. The language of solution set seems to make this much easier to talk about.

Questions to reflect on

1. Have you encountered students having these kinds of questions/confusions?

2. How do you explain to students what is going on when they are solving inequalities?

Notes

1. Interestingly, in practice, no matter what you do, it doesn't seem possible to create a significantly biased coin (Gelman & Nolan, 2002). (Of course, a double-headed coin would do the trick, though!)

2. This reminds me of a staffroom discussion about whether a student should receive most of the marks for obtaining a solution like $x<3$ to an inequality question to which the correct answer was $x>3$: "At least they got the right number; they just had the inequality sign the wrong way round" versus "They could hardly have been more wrong - the only possible answer that could have been less correct than this would have been $x \le 3$"!

Reference

Gelman, A., & Nolan, D. (2002). You can load a die, but you can't bias a coin. The American Statistician, 56(4), 308-311. https://doi.org/10.1198/000313002605 ($)


16 February 2023

Don't forget the units?

Sometimes, the units (e.g., cm) that come with a quantity can really help to make sense of what's going on. But do we always need units?

Recently, I was with some teachers who were arguing about a question like this:

What is the area of this rectangle?

Some of the teachers were complaining that the question was ‘wrong’, because the question writer had apparently ‘forgotten the units’! This was seen as ironic, because we are always telling students, “Don’t forget to include the units”, and yet here was a situation where this error had apparently been made in the writing of the question.

“You can’t have an area of 8,” someone said – “it has to be 8 somethings, like 8 centimetres squared.” The whole question was completely unspecified – what on earth is a “4 by 2” rectangle – imagine going into a shop to buy a carpet that is “4 by 2” – without some units it is completely useless!

I didn’t agree. I am quite happy to have a line segment of length 4 or a rectangle of area of 8. In pure mathematics, these things are dimensionless numbers. When we calculate the area enclosed between the curve $y=x^2$ and the curve $y=x(2-x)$, the answer is $\frac{1}{3}$. It doesn’t have any units, even though it really is an area. It isn’t $\frac{1}{3}$ of anything in particular, although I suppose you could say that it is $\frac{1}{3}$ of a unit square, if you wanted to. It would certainly be absurd to write the answer as $\frac{1}{3}$ cm$^2$ unless you were in some applied context in which you’d stated that the scales along the $x$ and $y$ axes were marked off in centimetres. The same applies if we use a formula like $$\int_a^b \sqrt{1+\left( \frac{dy}{dx} \right)^2} dx$$ to calculate the length along a curve: the answer has no units.

Confusion about units with things like this leads to students thinking that they need to write the words ‘square units’ after a definite integral. Similar confusions sometimes lead students to want to write the word ‘radians’ after $$\int_0^1 \frac{1}{1+x^2} dx=\tan^{-1} ⁡1=\frac{\pi}{4},$$ or possibly even writing $$\int_0^1 \frac{1}{1+x^2} dx=45°,$$ which makes no sense at all! (How would you respond to the question: "When you do a definite trigonometric integral, should you give the answer in radians or degrees?")

The debate around units seems to be one where both sides think that the other side is demonstrating some kind of dangerous misconception. Contexts are very important, as are the applications of mathematics, but I am not convinced that everything is always made clearer by setting it in context. The abstract concept of area can be used to solve real-world problems, like painting walls and laying carpets, but there is also just the abstract notion of area, which is measured in dimensionless numbers. If you are happy that you can have a number like 8, all on its own, which isn't a measure of anything in any particular unit, then it ought to be OK to have a length of 8 or an area of 8 too.

A similar issue arises when people object to tasks like:

Write down 5 positive integers with a mean of 7.

Write down 5 positive integers with a mean of 7 and a median of 4.

etc.

Sometimes, teachers object that when you are calculating a mean of a real-life dataset the data points are very unlikely to be nice, neat positive integers. And would it really make sense to calculate summary statistics from data sets containing so few numbers? How meaningful is a median when there are just 5 data values altogether? People who object in this kind of way would be much happier if all of the data points had a couple of decimal places, and ideally would like us to have 500 data points, rather than 5, and handle them in a modern fashion using technology.

This all seems very valuable to me, and I am all for students grappling with realistic, messy datasets, with all the opportunities they present for data cleaning, examining outliers and using descriptive statistics to get a handle on what’s going on. In such a task, there is a purpose - something you want to find out from the data - and the focus becomes less on the nitty gritty of adding up and dividing and more on asking meaningful questions and using the mathematics to figure out meaningful answers (i.e., mathematical modelling).

But I don’t see that kind of work as an alternative to tasks like the ones above. The arithmetic and geometric means (as well as the harmonic mean and other kinds of mean) are all essentially (and certainly were originally) pure mathematics concepts. Certainly, they have important applications to statistics, and elsewhere, but if you are dealing with the AM-GM inequality, for instance, there is no reason to think that the quantities being averaged must constitute some kind of 'realistic data set'.

There are times when context really helps students to get a sense of the underlying mathematics, but there are also times when context can get in the way. It seems likely to me that learners might get a better understanding of what the mean ‘means’ by using - at least at first - simple, easy to apprehend numbers. Tasks, for instance, in which you add an additional small integer value to a small, simple data set, and notice if the mean increases or decreases, or combine two small, simple data sets of different sizes, and explore what happens to the mean, seem very valuable to me. It can be through this kind of work that learners build a sense that the mean is the 'equal shares' value that 'balances' all the values in the set. In such tasks, it would be impossible to notice anything amid the noise of vast quantities of awkward numbers. Later on, of course, when applying the concept of the mean to the real world, we can bring those insights to bear on larger, more realistic data sets, but having messiness from Day 1, as the default, seems undesirable to me. I think there is no reason to feel guilty about asking learners to find the mean of a few small positive integers.

This is not to say that it's always wrong to 'begin with complexity'. Often that can be motivating and lead to powerful mathematics. But paring back the complexity at times, so as to see the mathematical structure, can also be really insightful and can support powerful generalisations. When we say that a 2 by 4 rectangle has area 8, we are effectively making a general statement that subsumes all of these:

A 2 cm by 4 cm rectangle has an area of 8 cm$^2$. 

A 2 km by 4 km rectangle has an area of 8 km$^2$. 

A 2 mile by 4 mile rectangle has an area of 8 mile$^2$. 

etc.

For me, to say "a 2 by 4 rectangle has area 8" isn't wrong, even though it doesn't apply directly to any one specific real-world area.

Questions to reflect on

1. Do you feel that 'an area of 8' is wrong? Why / why not?

2. When do you think that contexts are helpful and when do they get in the way?


02 February 2023

Non-expository video clips

How can video clips be used effectively in the teaching of mathematics? And I don't mean clips of someone explaining something...

If I do a Google search for "maths videos", I discover a tonne (258m hits) of short clips of mostly people explaining various bits of mathematics - with varying degrees of clarity and accuracy. I'm sure that some of these may have their uses, but they're not what I'm interested in in this blogpost. I assume that clips like those are rarely used in the classroom, if you have a live teacher who can do the explaining themselves in a more interactive fashion.

What I'm focused on in this blogpost are what I call 'non-expository' video clips. These are not trying to tell you something or explain something mathematical. They might not even be created with mathematics education in mind, although sometimes they are. But they are intriguing and engaging in their own right, and have obvious potential for mathematical discussions - whether it's to introduce a new concept or to apply some recently-taught ideas. They are just a minute or two at the most in length.

Lots of these I first found via Twitter, and I'd like to acknowledge whoever it might have been (now long forgotten) who forwarded them to me.

You don't need sound for any of these.

Here's the first one:

Cookie cutter

I think you could use this clip with pretty much any age of learner. You could just play the clip and let discussion emerge, or you could ask:

What do you notice? What do you wonder?

Getting students to describe as precisely as they can in words what they have seen can be helpful in getting them talking about it, and mathematical terms might find their way into what they say quite naturally.

If the discussion doesn't take a mathematical turn by itself, you can always ask:

Where is the mathematics here?

or

What do you think is mathematical about this?

For me, this particular clip triggers thoughts about area and perimeter. If you wanted to be more directive, you could ask explicitly:

What does this have to do with perimeter?

There is still lots of room for different comments to be made, even with this level of direction. Someone could start by saying what they understand by the word 'perimeter'. Someone else might say that the perimeter is getting smaller, and then someone else might disagree with that and say that the perimeter is constant, but the area enclosed is getting smaller.

Another way to use the clip would be to introduce the idea of a cookie cutter first, so that everyone knows what one is, bearing in mind that not all children may have had experiences of home baking.

Or you could begin one step back from that, by showing a picture like this:

You could ask what kitchen equipment would be needed to make these, and then how they think cookie cutters themselves are made. Students might have interesting ideas about that - and then you could ask, "Would you like to see a video clip of how they are made?"

Drawing a freehand circle

Here's another example of a clip that never fails to engage students:

Students could come to the board and see if they can do it. If you have an electronic whiteboard, you could record snapshots of their attempts (they could sign their name in the middle of their circle, so that you can tell which one is which). If you have a traditional board, you would need to take a photograph of the board after they have walked away (so that they aren't in the shot), before the board is wiped. Each student gets only one go. Then you can print out some of the best ones (you could get six onto one sheet of A4 paper) and ask:

How can we fairly decide which one is the best circle?

This can go in broadly two directions.

(i) Students think about what measurements they would need to make on the drawn circles. There is a lot of mathematics to consider, and this is not straightforward, because, for instance, shapes with constant width are not necessarily circular. They might suggest covering the drawn circle with accurate circles - maybe sandwiching it between the largest circle that will fit completely inside it and the smallest circle it will fit completely inside, and then finding the difference between the diameters of those two circles, a smaller value representing a 'more circular' circle.

(ii) Students treat it as a statistical project and ask everyone in the class to rank the 6 circles from best to worst. Then they have to think about what to do with these rankings to come up with an overall answer (there are several options here). If they take this approach, to avoid bias they might prefer to obscure the names written in the middle of the circles. Ideally, they might wish to use participants from a different class, who wouldn't have a chance of remembering who had drawn which circle.

Work based on drawing freehand circles could test hypotheses such as that it is easier to draw a large circle accurately than a small one, or that people improve at this the more they do it, or that doing it faster is better than doing it more slowly.

I think that lessons that use activities such as these can be very memorable. The idea that the perimeter could remain constant while the area changes might be referenced by saying, “Remember the cookie cutters?”

If you browse around https://www.youtube.com/ or a site such as https://free-images.com/ you can find all sorts of interesting images and videos that could support this kind of activity. Many years ago, I collected some together myself at http://www.mathematicalbeginnings.com/.

Questions to reflect on

1. Do you have examples of non-expository video clips that you often use?

2. Would you use clips like the ones mentioned here? Why / why not?

3. Which class(es) would you use them with, and how would you use them?


19 January 2023

Is zero really a number?

Zero is a strange number - learners sometimes even doubt if it is a number... 

In my articles in Mathematics in School, I often address 'Questions pupils ask' (I even have a book of that name, Foster, 2017). In this blogpost, I'm going to address a question that came from a learner and that relates to zero and units:

“Is there any point writing ‘metres’ after zero, as it will just be equal to zero?”

In other words, is ‘zero metres’ just exactly the same as the number ‘zero’, without any units? (“Zero m is just zero!”)

Teachers often stress the idea that ‘$1$ metre’ is not at all the same as the number $1$. We know that $1$ is a dimensionless number, whereas $1$ m is a length. So, we would never dream of writing:

$1$ m $= 1$, 

as this would be a dimensional catastrophe – as bad as saying something like ‘$1$ m $= 1$ kg’.

But is zero a different matter? If pupils think of ‘$1$ m’ as ‘$1$, multiplied by a metre’, as indeed it looks symbolically, then ‘$0$ m’ is ‘$0$, multiplied by a metre’, which is surely just zero, since zero multiplied by anything is just zero. Sometimes, when students are simplifying algebraic expressions (e.g., collecting like terms), they might simplify something like $$8a - 3m + a + m - 2a + 2m$$ by writing $7a + 0m$, but the teacher would probably say that there is no need to write the $+$ $0m$. Is it any more relevant to mention that "we haven't got any $m$'s" as it is to mention the absence of other quantities ($7a + 0m + 0r + 0mr + 0m^3$, etc.). In a particular context it might be worth being explicit about the zero $m$s (I sometimes find this useful when solving simultaneous equations by elimination, for instance, so as to keep everything nicely lined up in columns), but in general we wouldn't regard it as worth mentioning, so we would simplify to just $7a$. So, this feeling that $0m$ is just 'nothing' perhaps suggests that ‘zero metres’ should also be simplified to ‘zero’; i.e., nothing at all. Having no metres just means that you have nothing at all. Indeed, perhaps, on all the different dimensional scales of different quantities, the zeros coincide:

$0$ m $= 0$ kg $= 0$ °C $= 0$.


Clearly, it it not necessary to know any conversion factors to know that zero in any length unit, say, will be zero in any other length unit:

$0$ cm $= 0$ m $= 0$ inches $= 0$ furlongs $= ... $

But can it make any sense to write two zero measures on different dimensional scales as though they are equal, like $0$ m $= 0$ kg? This really looks wrong.

If it is right, does this mean that if a question says, “Give the units in your answer” that that is a subtle, unintended clue that the answer won’t be zero? Should a student not be penalised in an exam for omitting the units for a question where the answer is zero, such as this one?

The temperature on Tuesday is 2°C.
On Wednesday, it is 3°C warmer than it was on Tuesday.
On Thursday, it is 8°C colder than it was on Wednesday.
On Friday, it is 3°C warmer than it was on Thursday.
What temperature is it on Friday?
Give the units in your answer. 

Surely not, as here the units are very necessary, since an answer of ‘$0$’ for temperature could be $0$ °F or $0$ K, since the zeroes of temperature certainly don’t coincide with one another, let alone with the zero for kilograms. Maybe ‘all zeroes are equal’ only applies to quantities with a ‘true zero’, as opposed to those with ‘arbitrary zeroes’, like temperature.

But can this be right? Zero oranges and zero apples do not necessarily represent the same state of affairs: just because I’ve run out of oranges, it doesn’t necessarily follow that I must have run out of apples too.

One possible response is to say that, with measurement, 'zero never really means zero'. So, a statement like '$0$ m' really means 'zero metres, to some degree of accuracy', so this represents not a point but an interval on the metres number line, such as $-0.5 \leq $ length $ \lt 0.5$. (Although can length be negative? Possibly, say if it's a difference between two other lengths.) And now clearly $-0.5 \leq $ length $ \lt 0.5$ is different from, say, $-0.5 \leq $ mass $ \lt 0.5$, so the problem goes away. But in pure mathematics we can have an exact zero that is not rounded to any degree of accuracy.

Questions like this can make zero seem like ‘not a number’, or at least not like any other number, in ways that students may find disturbing. I remember a Year 10 (age 14-15) student remaining behind after a mathematics lesson to ask me a question she didn't want others to hear. I assumed it would be something personal, but it turned out she was embarrassed to ask ("This is probably a really silly question", etc.) the question: "I have always wondered, but is zero actually a number?"

It might be tempting to dismiss such questions. Of course zero is a number - it's on the number line. What else would we put half way between $1$ and $-1$? Would we want the number line to have a tiny, infinitesimally small gap 'at zero'? And if zero isn't a number, what else would it be? But there are instances where zero does indeed seem to be in a class of itself. One example is that it's neither positive nor negative. There are three kinds of real number: positive ones, negative ones, and then a class all of its own for the single number zero. I sometimes catch myself saying that the topic of 'directed numbers' refers to positive and negative numbers, or I might even call the topic 'positive and negative numbers', forgetting to say 'and zero', which is 'central' to the whole thing. It is interesting to contrast the question "Is zero a number?" with the (possibly related) question "Is infinity a number?", which I suspect different mathematics teachers would answer in different ways.

A question like the one I've discussed in this blogpost may feel very abstract, and why should we worry about such an unusual question? I am not claiming that lots of students are asking this particular question all the time. But uncertainty over things like this perhaps contributes to students' feelings that mathematics doesn't make any sense. Sometimes, I suspect, students who are confused or stuck in mathematics, and who we might regard as 'having difficulties', are in that position because they have thought further (rather than less) than their peers.

Questions to reflect on

1. Do you think that $0$ cm is 'the same thing' as $0$ kg? Would you dare to put an equals sign between them? Why/ why not?

2. Would you mark a zero answer wrong for not having the units?

3. What other issues do you see students having with zero?

References

Foster, C. (2017). Questions Pupils Ask. Mathematical Association.


05 January 2023

Proportionality

If 'proportional' or 'multiplicative' thinking/reasoning is the central idea in age 11-14 mathematics, then how might we do a better job of making approaches to this consistent across the curriculum, so that students develop a deeper understanding?

At Loughborough University, with colleagues Tom Francome and Chris Shore, we are currently working on putting together a complete set of free, editable teaching resources for mathematics at Key Stage 3 (ages 11-14), and we are particularly trying to do so in a 'coherent' fashion, meaning that everything is connected together into a story that makes sense (Note 1; Foster, Francome, Hewitt, & Shore, 2021). We hope it will be ready to release later in 2023.

In this blogpost, I'm going to reflect on some of the thinking that has gone in the 'Multiplicative Relationships' Unit in Year 7 (ages 11-12). This Unit isn't yet finished, but we have a structure and a bit of the detail, which I wanted to share here.

It seems to me that 'proportionality' is the central idea in 11-14 mathematics that so much else is related to, and so we make a big deal within the 'story of the curriculum' of $y=mx$. Moving too quickly on to $y=mx+c$ just muddies the main point, so we save the '$+c$' for later on (Foster, 2022) (Note 2). Initially, we want students to become very comfortable working with $y=mx$. Think of all the things that come under the umbrella of $y=mx$ and can be viewed as instances of this:

  • straight-line graphs through the origin
  • ratio and proportion
  • similar triangles
  • gradient
  • multiplication and division as inverses
  • speed, density and other 'rates'
  • rearranging formulae like $V=IR$ and $F=ma$
  • the basis for trigonometry (see Foster, 2021)

Often each of these content areas comes with a different notation, and this is something that we want to address in the name of 'coherence'. For example, we might write $y=mx$ for line graphs but $y=kx$ for 'proportionality', and students may miss that the 'constant of proportionality' $k$ is precisely the gradient of the corresponding $x$-$y$ graph. There is much to gain by seeing all multipliers and rates as gradients, so we try to use consistent notation to highlight this.

In addition to the different notations across topics, multiple different representations are commonly used, even just within the topic of ratio and proportion, such as ratio tables, double number lines, etc. Perhaps because everyone agrees that proportional reasoning is hard, there is a temptation to throw everything at it, piling lots of different ideas on students, hoping that something will make sense and stick. Instead, in our curriculum design work, we have tried to avoid this, and instead choose one powerful approach and then use it consistently and probe into it deeply.

Because $x$-$y$ graphs are not just a representation but part of the content of the curriculum (unlike more 'optional' representations, like ratio tables, that some teachers use and others might not), we focus throughout the LUMEN Curriculum on number lines and Cartesian graphs (which we see as two number lines coming together at right angles, intersecting at the origin). So, before we tackle 'proportionality' as such, we spend a lot of time making sense of multiplication through the family of graphs of $y=mx$.

We begin by taking two identical number lines and stretching one of them and (eventually) rotating it by 90°.

This develops into the idea of a rule, linking two number lines via points in the Cartesian plane.


We go on to stress multipliers, like the gradient, $m$, as the key number that takes you, by multiplication, from any (non-zero) number to any other number:

We use lots of examples like this to practise finding multipliers and missing numbers:

We then tackle a mixture of proportion problems with 'nice' numbers as well as ones with 'hard' numbers. Below, we begin with a situation that uses 'nice' numbers. First we raise and discuss the 'additive' error:

Then, we work multiplicatively, first 'between variables' (i.e., from one variable to the other), using the same arrow notation for multipliers as we used earlier:

Then we find 'within variables' multipliers:

We contrast multipliers 'between variables' (which we call rates) with multipliers 'within variables', which we call scale factors. Scale factors are always dimensionless, whereas rates sometimes have units (e.g., here Rosie's multiplier was £/km). 

Whether a rate or a scale factor is more convenient depends on the numbers; hence, tasks like this:

This eventually builds up to being able to use any of the elements from this kind of diagram:

(The diagram looks overwhelming with everything included. But in any situation you would only use 2 of these arrows at once, always the same colour as each other.)

This is all very much work in progress, and we'd be very glad of any thoughts or criticisms of what we're doing!

Questions to reflect on 

1. Do you agree about the centrality of proportionality in the lower secondary mathematics curriculum?

2. What do you like and dislike about the approach outlined here? 

3. In what ways is it similar to or different from what you typically do?

Notes 

1. To find out more about the LUMEN Curriculum, go to https://www.lboro.ac.uk/services/lumen/curriculum/

2. And, when it comes, I think that $y=mx+c$ might be better encountered as $y-c=mx$. This way, rather than seeing $y=mx+c$ as a non-example of proportionality, we see it as another example of proportionality, but we just 'have the wrong origin'. So, the shift to $y-c$ as our variable, rather than $y$, makes it understandable as another instance of a proportional relationship. 

References 

Foster, C. (2021). On hating formula triangles. Mathematics in School, 50(1), 31–32. https://www.foster77.co.uk/Foster,%20Mathematics%20in%20School,%20On%20hating%20formula%20triangles.pdf

Foster, C., Francome, T., Hewitt, D., & Shore, C. (2021). Principles for the design of a fully-resourced, coherent, research-informed school mathematics curriculum. Journal of Curriculum Studies, 53(5), 621–641. https://doi.org/10.1080/00220272.2021.1902569

Foster, C. (2022). Using coherent representations of number in the school mathematics curriculum. For the Learning of Mathematics, 42(3), 21–27. https://www.foster77.co.uk/Foster,%20Using%20coherent%20representations%20of%20number%20in%20the%20school%20mathematics%20curriculum.pdf


22 December 2022

Mixing the dimensions in models of number

Not all commonly-used representations of number are necessarily equally helpful. We shouldn't just assume that anything 'visual' will automatically be helpful - some representations might even be counterproductive.

An emphasis on conceptual understanding in mathematics often seems to be linked with the use of visual representations. If you care about helping your students to make sense of mathematics – as opposed to just following standard, symbolic procedures – then you are likely to be keen on visual models. If a picture can paint a thousand words, then in mathematics a helpful visualisation might easily surpass multiple sentences of wordy explanation, whether written or oral, or many lines of mathematical symbols. It may also be that visualisation offers ways to support students who are more likely to be disadvantaged by traditional approaches to learning mathematics (Gates, 2018).

I very much like diagrammatic ways of showing mathematical properties and relationships (e.g., see Mattock, 2019, for a beautiful collection of examples), and some of my favourite books are the volumes of Proofs without Words (Nelson, 1993, 2000, 2016). However, I think a positive view of diagrams can sometimes lead us to be a little uncritical about cases where diagrams may be problematic. We should not just assume that anything ‘visual’ must be a good thing. In particular, if certain representations have the potential to create or embed particular misconceptions, so making understanding harder to achieve, then this is something we should worry about. The fact that students may say that they like certain visual representations is not enough, as it may not be possible for them to be aware at the time of possible problems coming down the line as a result of the representations that they are using. It relies on the teacher to look ahead and consider how future problems might be being set up by what is currently taking place.

I am a big fan of 1-dimensional, ‘linear’ models, such as number lines, and I include in this category any representation that has just one variable or dimension, even if it isn’t drawn in a straight line (see Foster, 2022). So, for me, a circular number line, like on a speedometer or clock, is still a kind of 1-dimensional number line, as is a spiral number line. So is a number track, such as the snaking squares on a snakes-and-ladders board, because all of these are still unidimensional representations (you can only go either forwards or backwards – ignoring the snakes and ladders themselves!). I see all of these as linear, even though they of course have to take up 2-dimensional space, otherwise we wouldn’t be able to see them (Note 1).

However, I think that I am coming round to the view that I am not a fan of 2-dimensional representations of number, because they are inevitably mixed-dimensional, and I think this is quite problematic (Foster, 2022). To explain what I mean, consider ‘algebra tiles’, as embodied in diagrams (or physical or virtual manipulatives) like those shown in Figure 1 (Note 2).


Figure 1. 
Algebra tiles representing (a) $3(x+2)\equiv3x+6$  and (b) $(3x+6)(x+1)\equiv3x^2+9x+6$

In Figure 1a, the area 6 is represented by a blue 2 × 3 rectangle, and, in Figure 1b, we have another area of 6, this time represented by a blue 1 × 6 rectangle. This is fine, because it seems perfectly reasonable to say that both of these represent the same number 6 (Figure 2a), because they have the same area as each other. We could break up either one of them and fit it completely into the space occupied by the other. However, my difficulty is that in Figure 1b we also have the number 6 represented by the (1-dimensional) purple line segment at the top right (see Figure 2b), meaning that the same number is represented, in the same diagram, by both a 1-dimensional line segment and a 2-dimensional area.


Figure 2. (a) a reasonable equality; (b) an unreasonable equality


I think this mixed-dimensional feature of area models of number is unfortunate, and becomes quite problematic the more you think about it. A rectangle and a line segment are not just different things (like two different rectangles) – they are different kinds of things. It’s OK if we sometimes represent a number by a 1-dimensional length, and other times by a 2-dimensional area – and we maybe sometimes represent it by all sorts of other things – but to do both of these simultaneously in the same diagram seems like asking for trouble. I am not sure how much relational understanding (Skemp, 1976) can be said to be going on if students have not noticed or thought about this. And this is not something that occasionally happens with representations like these, in certain awkward cases – it happens every time.

I am perfectly happy that there is no dimensional problem with writing an expression like $3x^2+9x+6$, because $x$ is a pure number, without any units, so this is just of the form 'number + number + number', which is equal (unsurprisingly) to 'a number'. But, as soon as you start to represent an expression like this using algebra tiles, it begins to look very much as though you have 'area + area + length', or maybe 'area + length + length'. In Figure 1a, $3x+6$ is 'area + area', but when, in Figure 1b, we want to multiply this expression further by $x+1$, we somehow have to shift our thinking down a dimension, and reconceive $3x+6$ as 'length + length', so that we can multiply it by another ‘length’ (the $x+1$), so as to obtain a quadratic expression, which is now represented as an area. Alternatively, we could retain $3x+6$ as area + area, and multiply it by length + length to give a volume in 3 dimensions, and, although this is tricky to sketch on paper, 3D models can be insightful. But then you are stuck if you want to go any further.

I think this problem is often overlooked, because algebra tiles are often used to multiply two linear expressions, like $x+b$ and $x+d$. We are very pleased with the fact that the leading term in the expansion is $x^2$, and that ‘$x$ squared’ is represented by ‘a square’. This seems great – we visualise an algebraic square by means of a geometrical square – what could be nicer? But, we overlook that the other terms in the expansion have less convenient interpretations – we have a $bx$ and a $dx$ rectangle, and a $bd$ rectangle, and it’s unclear why it’s appropriate for all three of these to be rectangles, given that things very like them were lengths at the beginning.

Even if you restrict ‘algebra’ tiles to numbers, and use them to work out things like $12\times46=(10+2)\times(40+6)=552$, I think you have exactly the same problem. The 2, say, in the original 12 looks visually like a completely different kind of a thing from the 2 in the 552, but they are both meant to be 2 ones. One of the most basic requirements of a good representation is that the same thing (e.g., 2) should be represented by the same thing (e.g., either a line segment of length 2 or a rectangle of area 2, but not both).

There is something nice about the dynamic in a classroom where students are fiddling around with physical algebra tiles, rearranging them and fitting them into rectangles and talking about what they are doing. It seems like just the sort of activity that should develop conceptual understanding. Students are actively manipulating representations that make the mathematical structure visible and figuring out what is possible and what is impossible. But, whether or not the jigsaws get completed, I worry that mixed-dimensional models like this have the potential to be more confusing than helpful.

I have expanded on the argument of this blogpost in Foster (2022).

Questions to reflect on

1. Do you use mixed-dimensional representations of number, like algebra tiles? If so, when and why?

2. What do you think about the concerns I've expressed in this post?

Notes

1. Manipulatives, like Cuisenaire rods or cubes, are harder to classify, because you can do lots of things with them, and not all of these things are 'linear'. For example, you can use them to make rectangles with an area of 12 square units. So I think whether they are ‘linear’ or not depends on what you do with them.

2. To generate diagrams like this conveniently, go to https://mathsbot.com/manipulatives/tiles.

References

Foster, C. (2022). Using coherent representations of number in the school mathematics curriculum. For the Learning of Mathematics, 42(3), 21–27. https://www.foster77.co.uk/Foster,%20Using%20coherent%20representations%20of%20number%20in%20the%20school%20mathematics%20curriculum.pdf

Gates, P. (2018). The importance of diagrams, graphics and other visual representations in STEM teaching. In R. Jorgensen, & K. Larkin (Eds), STEM education in the Junior Secondary: The state of play (pp. 169-196). Springer. https://www.researchgate.net/profile/Peter-Gates-4/publication/319086868_The_Importance_of_Diagrams_Graphics_and_Other_Visual_Representations_in_STEM_Teaching/links/5d094203299bf1f539cef6d3/The-Importance-of-Diagrams-Graphics-and-Other-Visual-Representations-in-STEM-Teaching.pdf

Mattock, P. (2019). Visible Maths: Using representations and structure to enhance mathematics teaching in schools. Crown House Publishing Ltd.

Nelsen, R. B. (1993). Proofs without words: Exercises in visual thinking. The Mathematical Association of America.

Nelson, R. B. (2000). Proofs without words II: More exercises in visual thinking. Washington. The Mathematical Association of America.

Nelson, R. B. (2016). Proofs without words III: Further exercises in visual thinking. The Mathematical Association of America.

Skemp, R. (1976). Instrumental understanding and relational understanding. Mathematics Teaching, 77, 20-26. http://math.coe.uga.edu/olive/EMAT3500f08/instrumental-relational.pdf

08 December 2022

Dividing into thirds

How accurately do things need to be drawn to evidence conceptual understanding? When are accurate drawings helpful and when are they unnecessary?

Suppose that you asked a child to divide a disc into thirds, and suppose they drew something like this:

How would you respond? Are they right? It is only a sketch, after all.

Now imagine an equally scruffy sketch like this:

Full marks this time? I can imagine the second one being treated as more acceptable than the first, even if both were drawn equally accurately.

In fact, here, the first one of these is drawn more accurately into thirds than the second one is. But, might that just be 'luck', and not evidencing a clear understanding of what 'thirds' are? What are we trying to judge here? A small child may have a better eye than me, and be better at estimating equal areas accurately than I am. Is that the thing that matters?

Perhaps the teacher is expecting/hoping to see sectors drawn, and they view parallel lines suspiciously, as they worry that the child might be intending to indicate evenly-spaced lines, as shown below, which divide the vertical diameter into thirds, but would not divide the area of the disc into thirds. Intending to draw this might be counted as a 'misconception'.

But, is it fair to the first child to assume that this is necessarily what they must be thinking? Without talking to them about their idea, it seems hasty to dismiss what they have drawn. But, they might struggle to express in words that the two lines are somewhat closer to each other than they are to the ends of the vertical diameter - and it would certainly be hard to say how much closer they ought to be (Note 1).

Dividing a circle into thirds precisely with parallel lines is tricky, and requires some calculation.

Suppose we have a unit circle below, centre $O$.

We want to know the angle $\theta$ radian which makes the area of the blue shaded segment exactly $\frac{1}{3}$ of the area of the whole disc.

Now, 

$$\text{area of blue segment}=\text{area of sector } – \text{ area of isosceles triangle}.$$

So,

$$\frac{\pi}{3}=\frac{1}{2}\times1^2\theta-\frac{1}{2}\times1^2\sin\theta,$$

giving

$$\frac{2\pi}{3}=\theta-\sin\theta.$$

This equation cannot be solved analytically, but we can get a numerical solution as accurately as we wish, and this turns out to be $\theta=2.605,325,...$ radian. Converting to degrees, this is $149.27^{\circ}$, correct to 2 decimal places. It is kind of neat that the required triangle is so close to a $15$-$15$-$150$ isosceles triangle.

Drawn accurately, it looks like this:

which might be a bit hard to distinguish from the equally-spaced incorrect version drawn above.

Here they are side by side:


With a bit of thought, it is clear that the vertical positions of these lines are just as good for any ellipse with a vertical major axis of this length, as others have noted (see https://www.forbes.com/sites/kevinknudson/2015/08/11/cutting-into-thirds-or-how-a-mathematician-spends-an-hour-figuring-out-how-to-divide-a-casserole/):

This leaves me thinking that no one is going to be good at drawing these lines in the right position by eye. And I am not sure to what extent learning about fractions ought to be dependent on ability to estimate the relative sizes of areas bounded by arcs, like these. I don't think I'm particularly good at it (Note 2). But how should we get a sense of children's understandings of fractions when we look at their drawings and explanations? And should we be more cautious in our assumptions when we look at their drawings?

It isn't always clear what we intend to communicate when we make sketch drawings like these, and when the accurate details matter and when they don't. It certainly isn't easy to draw perfect circles freehand on a whiteboard (see Foster, 2015), and, even if you are using technology to display perfect circles, projectors can do funny, distorting things. I have seen a lesson on circle theorems in which none of the circles displayed was remotely circular. They looked fine on the teacher's computer screen (as they presumably did at home the night before, when planning the lesson), but, once projected, they were distinctly oval. How much does this matter? No circle in the real world can ever be completely perfect, so we always have to use our imagination. Every student in the lesson knew that the lesson was about 'circle theorems', not 'oval theorems', and that these images were representing circles. So was this therefore fine? Where the diagram is deficient, the viewer has to do some of the work to visualise it properly, and sometimes this can be helpful. But, in this case, given that it was an introductory lesson to circle theorems, I felt that the distorted figures were merely an extra burden on everyone's cognitive load. They seemed more likely to get in the way of the students' attempts to make sense of the relevant geometrical properties and relationships.

People find it much harder to judge the relative area of sectors than of rectangles (Burch & Weiskopf, 2014) - look at the same data below presented as a pie chart and then as a bar chart:


Perhaps it is time we moved away from using circle diagrams for teaching fractions altogether (see Foster, 2022)?

Questions to reflect on

1. How would you convince someone that the calculated position of the lines for a circle works just as well for any ellipse?

2. What do you see as the role of circle drawings like this for learning about fractions? Are other visuals (e.g. rectangles) preferable?

3. When is accuracy important and when isn't it?

Notes

1. I suppose you could also say that the division into sectors divides the circle (i.e., the circumference) into thirds, as well as divides the disc (i.e., the area) into thirds, whereas the parallel lines divide only the area into thirds.

2. Similar criticisms might be made about the value of training students to estimate angles in degrees with better accuracy. Tasks like this https://nrich.maths.org/1235 can be fun, but how important is this as a mathematical skill that is worth improving? I think that such tasks have value in gaining a sense of what 'one degree, ten degrees, etc.' look like, which seems as important as knowing what '1 centimetre' looks like.

References

Burch, M., & Weiskopf, D. (2014). On the benefits and drawbacks of radial diagrams. In E. Huang (Ed.), Handbook of human centric visualization (pp. 429-451). Springer.

Foster, C. (2015). Exploiting unexpected situations in the mathematics classroom. International Journal of Science and Mathematics Education, 13(5), 1065–1088. https://doi.org/10.1007/s10763-014-9515-3

Foster, C. (2022). Using coherent representations of number in the school mathematics curriculum. For the Learning of Mathematics, 42(3), 21–27. https://www.foster77.co.uk/Foster,%20Using%20coherent%20representations%20of%20number%20in%20the%20school%20mathematics%20curriculum.pdf


Teaching specific tactics for problem solving

This is my final blogpost, as my year as President of the Mathematical Association draws to a close, so I've allowed myself to go on at ...